Distributed Rate Limiting: Your Effective Limit Isn't Your Config
Per-pod counters, fixed-window edges, and the wrong key quietly change the limit you enforce. Here's the math, the fixes, and a test you can run in staging.
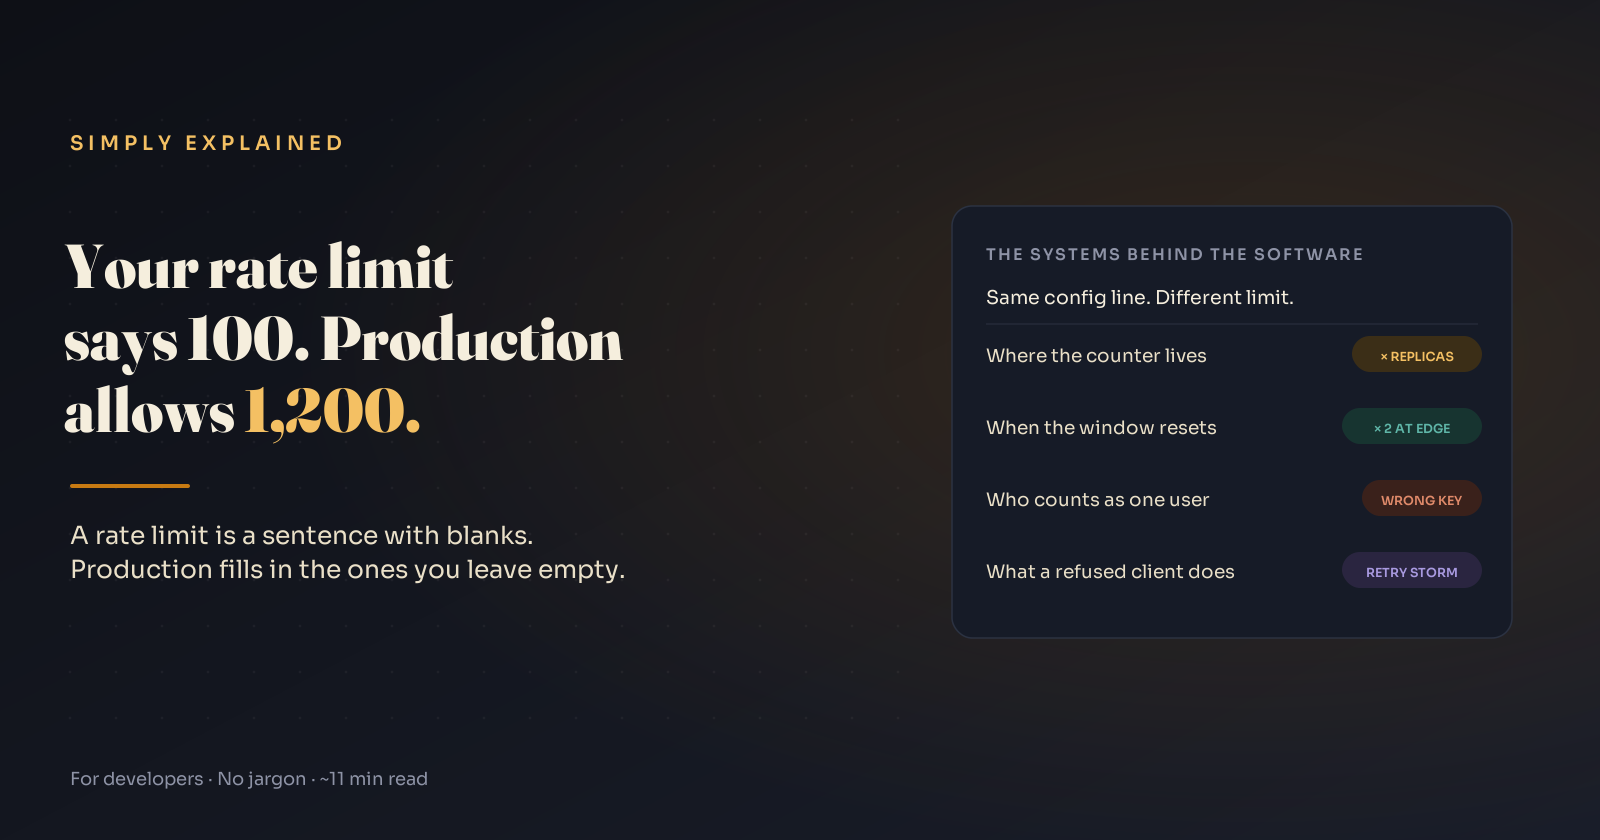
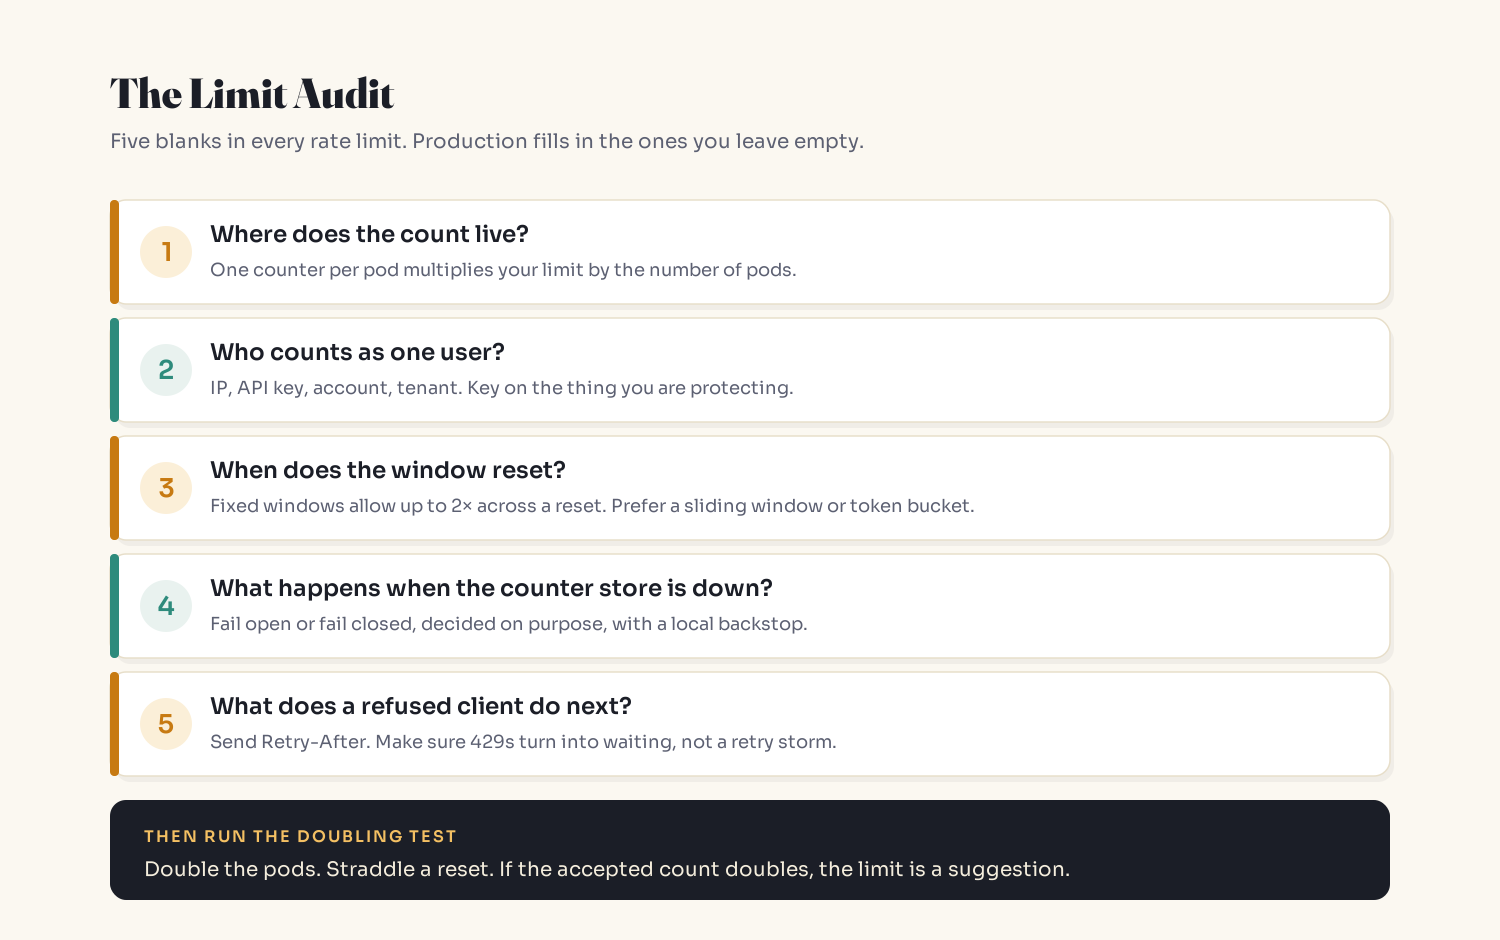
TL;DR: A rate limit is not one number. It's a sentence: N requests, per key, per window, counted in some place, and refused clients do something next. Your config sets N. Production sets the rest. Per-pod counters multiply the limit by your replica count, fixed windows let up to 2N through across a reset, and the wrong key makes the limit too loose and too strict at the same time.
You might have this bug if...
- Your limiter keeps its counter in process memory, or in a gateway that runs more than one replica.
- You use a fixed window ("requests this minute") and some clients run on a schedule.
- You key by IP address.
- Your 429 response has no
Retry-Afterheader. - Your Redis limiter calls
INCRandEXPIREas two separate commands.
If you ticked one, the number in your config is not the number you enforce. Here's how far apart they get.
The effective-limit formula
For a single user in the worst case:
effective_limit ≈ N × (independent counters) × (edge factor)

independent counters = 1 for a shared store, replica count for per-pod memory
edge factor          = 2 for fixed windows, about 1 for sliding windows / token buckets
Worked example with limit: 100 requests per minute, per user:
| What production adds | Effective limit in one minute |
|---|---|
| Config as written | 100 |
| 6 pods, each with its own in-memory counter | 600 |
| A burst that straddles the window reset | 1,200 |
| Autoscaler grows the fleet to 12 pods during the spike | 2,400 |
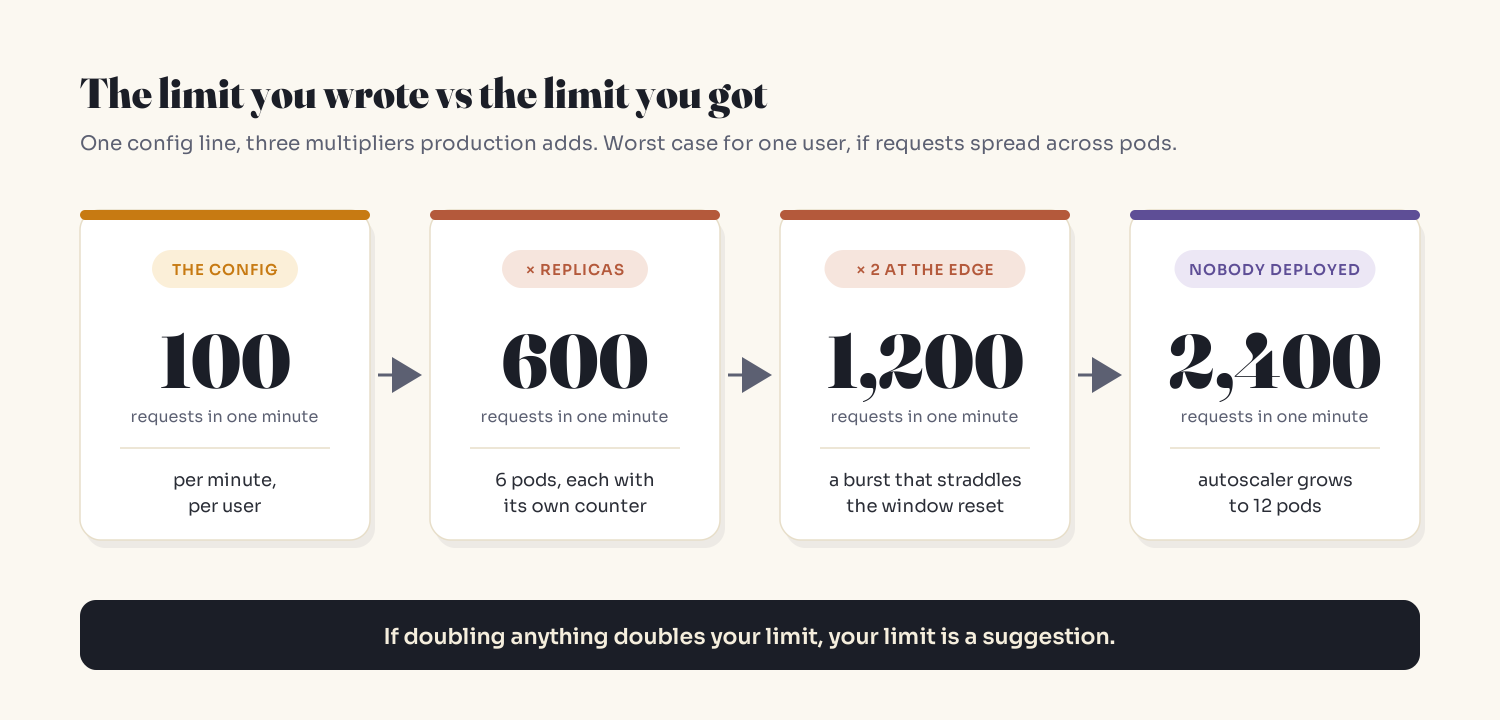
The per-pod multiplier assumes the load balancer spreads that user's requests across pods. When it doesn't, you get the opposite problem, covered below.
Leak 1: local vs global rate limiting
A local limiter counts in each instance's memory. A global limiter counts in a shared store that every instance consults.
| Local (per instance) | Global (shared store) | |
|---|---|---|
| Latency | No network hop | One round trip per request |
| Accuracy | Limit × replica count | One limit for the fleet |
| Scales with autoscaler? | Yes, which is the problem | No |
| New failure mode | None | Store outage or slowness |
This is documented behavior, not a corner case. The Envoy Gateway docs say local limits apply independently inside each proxy instance, with the example of 50 requests per minute on two replicas allowing up to 100 in total. Ingress NGINX added a note to its docs that rate limits are applied per controller replica, and put "per controller replica" into the limit-rps, limit-rpm and limit-connections annotation descriptions.
The sneaky part: replica count is dynamic. An autoscaler that adds pods under load raises a local limit exactly when you need it to hold, with no deploy and no diff.
Leak 2: fixed-window boundary bursts
A fixed window resets the counter at 12:01:00. A client sends 100 requests at 12:00:55 and 100 at 12:01:00. Each window counts 100 and allows it. Your backend absorbs 200 in about ten seconds.
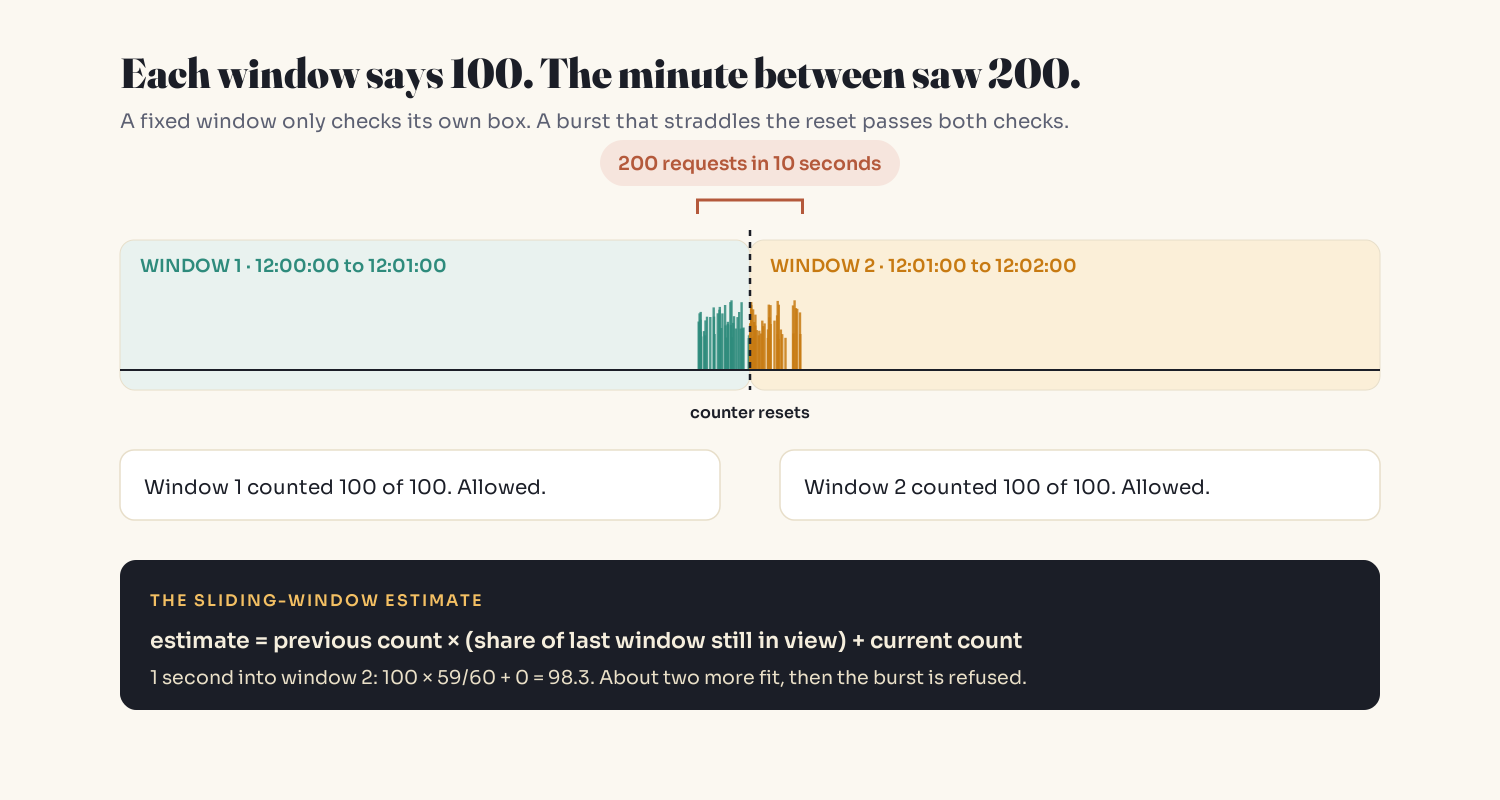
Scheduled work (cron jobs, batch syncs, clients that refresh on the minute) hits window edges without anyone trying.
| Algorithm | Worst-case burst | State per key | Notes |
|---|---|---|---|
| Fixed window | 2N across a reset | 1 counter | Simplest, leaks at edges |
| Sliding window log | N | 1 timestamp per request | Exact, memory-heavy |
| Sliding window counter | About N | 2 counters | Weighted estimate, cheap |
| Token bucket | Bucket size (explicit) | Tokens + last refill time | Burst is a setting, not an accident |
The sliding window counter estimates the last 60 seconds as previous_count × (overlap share) + current_count. Cloudflare described this approach and tested it on 400 million requests from 270,000 sources: 0.003% of requests were wrongly allowed or limited. Stripe's engineering blog says it uses the token bucket algorithm for request rate limiting.
Leak 3: choosing the rate limit key
| Key | Easy to multiply by | Shared by accident with |
|---|---|---|
| IP address | Botnets, serverless pools, rotating proxies | Offices behind NAT, universities, mobile carriers |
| API key | Creating more keys | Teams sharing one key |
| Account / tenant | Opening more accounts | Every integration in a large customer |
Pick the key from the job. Abuse prevention wants the key that's hardest to multiply. Fair sharing wants the key that matches who pays. Capacity protection wants no per-user key at all: it protects the endpoint. Those are three different limiters.
When the effective limit is lower than N
Production can also make the limit stricter than the config.
Divided limits plus pinned connections. If you "fix" local limiters by setting each pod to N divided by the replica count, a client whose traffic rides one keep-alive or HTTP/2 connection lands on one pod and gets a fraction of N. Connection-level load balancing balances connections, not requests.
Retries spend the same budget. RFC 6585 defines 429 Too Many Requests and says the response may include Retry-After. Without it, clients guess, usually "now," and each retry is refused and counted again.
The counter that never resets. This pattern has a race that the Redis INCR documentation calls out:
count = r.incr(key)
if count == 1:
    r.expire(key, 60)   # crash before this line and the key never expires
If the process dies between the two calls, the key has no TTL. For a rate limiter that means a counter that never resets and a user who stays blocked until someone deletes the key.
The two blanks nobody fills
Fail open or fail closed. A global limiter depends on its store. Stripe's write-up recommends that coding or operational errors in limiters fail open so the API stays up. That fits abuse limiting. If the limiter is the only thing protecting a fragile downstream, keep a generous local per-pod limit as a backstop for when the shared store is unreachable.
Rate isn't cost. A rate limit counts arrivals, not how long requests hold workers or connections. Stripe described running a concurrent-requests limiter alongside its request-rate limiter for this reason. For slow endpoints sharing a database, a concurrency limit or cost-weighted tokens protect you where a request count can't. (Related: connection pool exhaustion.)
Implementation: an atomic sliding-window limiter in Redis
The Lua script does the read, the decision, the increment and the expiry in one atomic step:
-- KEYS[1] = counter for the current window   e.g. rl:{user:42}:28911204
-- KEYS[2] = counter for the previous window  e.g. rl:{user:42}:28911203
-- ARGV[1] = limit, ARGV[2] = window length in seconds,
-- ARGV[3] = seconds elapsed in the current window
local limit   = tonumber(ARGV[1])
local window  = tonumber(ARGV[2])
local elapsed = tonumber(ARGV[3])

local prev = tonumber(redis.call('GET', KEYS[2]) or '0')
local curr = tonumber(redis.call('GET', KEYS[1]) or '0')

local estimate = prev * ((window - elapsed) / window) + curr
if estimate >= limit then
  return 0  -- refuse: respond 429 with Retry-After
end

redis.call('INCR', KEYS[1])
redis.call('EXPIRE', KEYS[1], window * 2)
return 1    -- allow
A Python caller that uses Redis's clock, so every pod agrees on the window:
import redis

r = redis.Redis()
limiter = r.register_script(open("sliding_window.lua").read())

def allow(user_id: str, limit: int = 100, window: int = 60) -> tuple[bool, int]:
    sec, usec = r.time()                      # one clock for every pod
    now = sec + usec / 1_000_000
    idx = int(now // window)
    elapsed = now - idx * window
    cur = f"rl:{{user:{user_id}}}:{idx}"      # {...} = same Cluster slot
    prev = f"rl:{{user:{user_id}}}:{idx - 1}"
    allowed = limiter(keys=[cur, prev], args=[limit, window, elapsed])
    retry_after = max(1, int(window - elapsed))   # simple upper bound
    return bool(allowed), retry_after
The hash tag in the key name keeps both keys in one Redis Cluster slot, which a multi-key script requires. Return retry_after in a Retry-After header on every 429.
The Doubling Test
The audit says what should happen. This says what does. Run it in staging:
- Double the pods. Same burst from one test key against 1 replica, then 2. If successful responses double, your counter is local.
- Straddle a reset. Start a burst a few seconds before a window boundary and keep it going a few seconds after. If close to 2N succeed, your window has edges.
# Fire 300 requests from one test key, then count status codes
for i in $(seq 1 300); do
  curl -s -o /dev/null -w "%{http_code}\n" \
    -H "Authorization: Bearer $TEST_KEY" \
    https://staging.example.com/api/ping
done | sort | uniq -c
If doubling anything doubles your limit, your limit is a suggestion.
Key Takeaways
- A rate limit is a sentence: N, per key, per window, counted where, and what refused clients do. Config only sets N.
- Per-pod counters multiply the limit by replica count, and the autoscaler changes that count for you.
- Fixed windows allow up to 2N across a reset. Use a sliding window counter or a token bucket with an explicit burst.
- The key decides who gets multiplied and who gets blocked by accident. Pick it from what you're protecting.
- Effective limits can also shrink: divided local limits plus pinned connections, retries without
Retry-After, andINCR/EXPIREraces. - Decide fail open vs fail closed on purpose, and add a concurrency limit when request cost varies.
FAQ
What is distributed rate limiting?
Distributed rate limiting enforces one limit across many instances of a service by keeping the count in a shared store, such as Redis, instead of each instance's memory. Without it, every instance enforces its own copy of the limit.
Why does my rate limit allow more requests than configured?
Usually because the counter is local to each pod or gateway replica, so the effective limit is the configured limit times the replica count. Fixed windows can double that again for bursts that straddle a window reset.
Is NGINX or Ingress NGINX rate limiting per replica?
Ingress NGINX documents its rate limits as applied per controller replica. With three controller replicas, a client spread across them can get up to three times the configured rate.
Fixed window vs sliding window vs token bucket: which should I use?
Fixed windows are simplest but allow up to twice the limit across a reset. A sliding window counter estimates the last full window with two counters and stays close to exact. A token bucket makes the allowed burst an explicit setting. Pick sliding window for a strict "N per minute" and token bucket when you want controlled bursts.
Should a rate limiter fail open or fail closed when Redis is down?
Abuse limiters usually fail open, because blocking every customer is worse than a few minutes of excess traffic. If the limiter protects a fragile dependency, keep a local per-instance backstop so it still caps load when the shared store is unreachable.
Should I rate limit by IP address or API key?
Neither is right in general. IP keys are easy to multiply with many addresses and get shared by offices, campuses and mobile carriers. API keys can be multiplied by creating more keys. Choose the key based on what you're protecting: abuse, fair sharing between customers, or the endpoint's capacity.
Related reading
- Metastable Failures: Why Your System Stays Down After the Cause Is Fixed: what happens when refused clients all retry at once.
- Your Database Is Fine. Your App Is Dying Anyway.: why counting requests doesn't protect a shared pool.
- Nobody Deployed Anything. Production Broke Anyway.: the autoscaler is one of the changes that never ships through a deploy.
The bottom line
The number is the one blank you filled on purpose. The others were filled by your load balancer, your autoscaler, your clock and your clients. If you can't name all five, the one you can't name is where the next incident starts.
A rate limit isn't the number in your config. It's the sentence your system actually enforces.
New here? Start Here: A Plain-English Map to Understanding AI lays out the whole library. Get one of these in your inbox each week: subscribe to the Simply Explained newsletter.
Adam Jaber is a software engineer who writes Simply Explained: complex topics, made simple. No jargon, no hype.
About the author
- I'm a senior software engineer. I write Simply Explained, a plain-English breakdown of how AI and software actually work, and the quiet ways they break: AI fixes that hide bugs, agents that pick the wrong tool, health checks that take down healthy servers. One symptom, one analogy, one fix per piece. New here? Start with the pinned Start Here guide, or get one breakdown a week by email.
Comments
Join the discussionI'd have the Lua script return the wait time, because window minus elapsed tells a refused client the wrong thing about a sliding window. With the weighted estimate, capacity comes back gradually, at prev/window per second, about 1.7 requests per second in your 100-per-minute example. A client refused because of last window's weight is often allowed again within a second or two, yet Retry-After sends it to the boundary. Every client refused during that minute gets the same boundary, so they all come back together, and the edge burst you removed returns through the retry path.
Inside the script, when estimate >= limit and prev > 0, the wait is (estimate - limit) * window / prev, rounded up with a one-second minimum and capped at the time left in the window. One small thing in the caller too: int() truncates, so a client refused at 30.4 seconds is told 29 and arrives just before the reset. math.ceil fixes that.
The Systems Behind the Software
Plain-English deep dives into the backend and system-design ideas that quietly run everything — caching, idempotency, databases, distributed systems, and the subtle bugs the obvious approach never prevents. No jargon, no hype. Each piece starts with a real production problem, builds the intuition, then shows how to actually get it right.