Tail Latency and Fan-Out: Why Your p99 Isn't a 1% Problem
The arithmetic that turns a rare slow call into a common slow page, the measurement habits that hide it, and how to budget for it.
Here's a quick question worth answering before you read on.
Your profile service hits its target: 99% of requests finish in under 200 ms. The account page calls it, plus 39 other services that hit the same target. What share of account page loads include at least one slow call?
If your gut said "about 1%," you're in good company, and you're off by a factor of 33. The answer is about one in three.
That gap is tail latency, and this post is about the arithmetic behind it, the three measurement habits that keep it invisible, and the fixes that actually work.
The fan-out formula
A p99 is a statement about requests. A user experiences pages, and a page waits on many requests. Whether the calls run in parallel (the page waits for the max) or in sequence (it waits for the sum), one slow call means a slow page.
If each call is independently slow with probability p, the chance a page with n calls hits at least one slow call is:
P(slow page) = 1 - (1 - p)^n
With p = 0.01:
| Calls per page | Chance of a slow page |
|---|---|
| 1 | 1% |
| 10 | 9.6% |
| 20 | 18.2% |
| 40 | 33.1% |
| 100 | 63.4% |
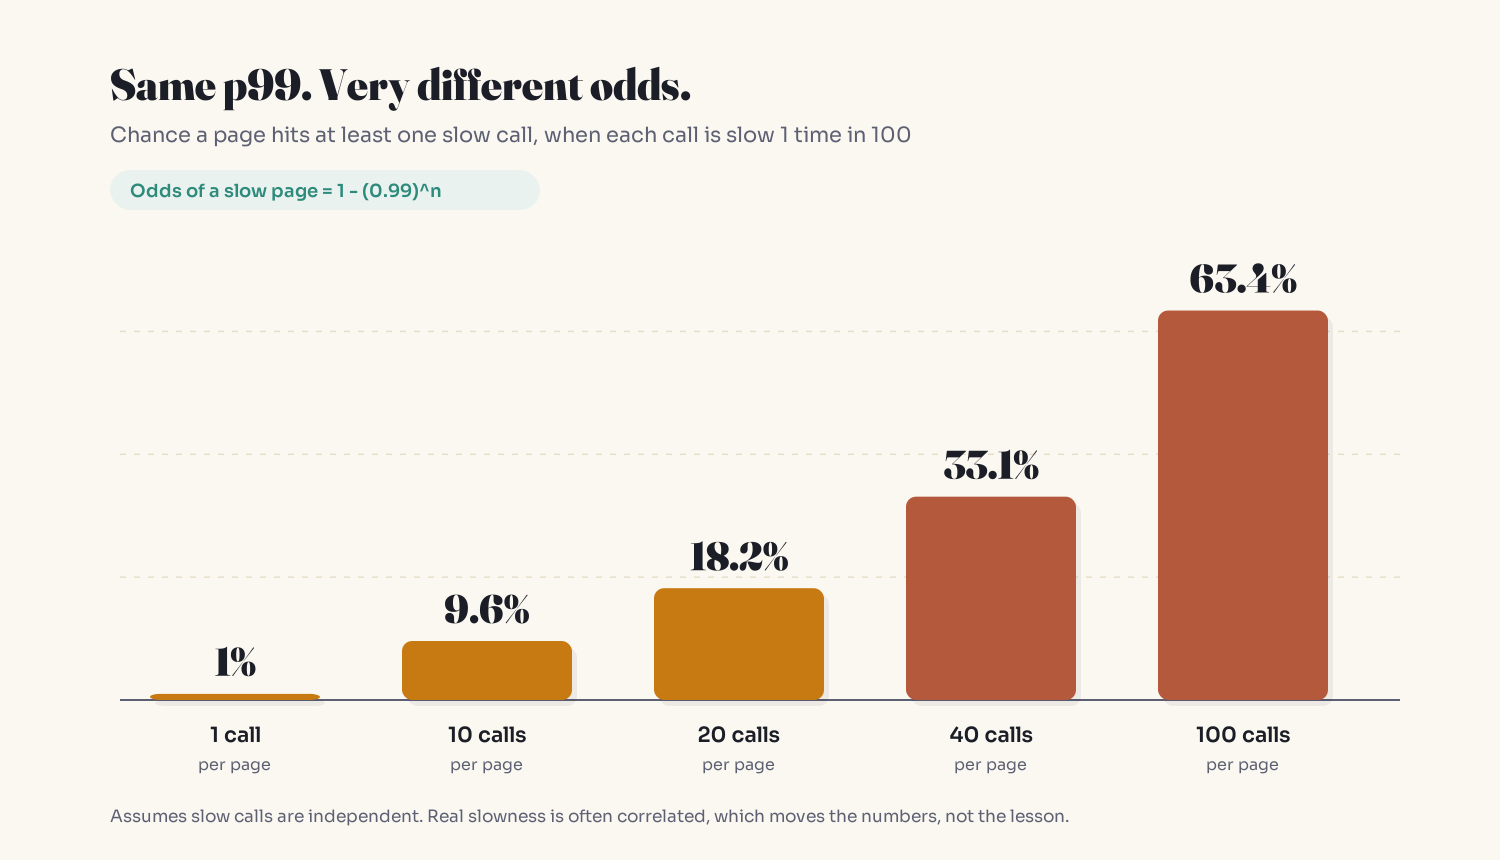
The 100-call row is the famous one. Jeff Dean and Luiz André Barroso used it in their 2013 Google paper, The Tail at Scale: a server that's slow on 1 request in 100, fanned out across 100 servers, makes 63% of user requests slow. The same logic turns a 1-in-10,000 slowness into nearly a 1-in-5 problem across 2,000 servers.
Two notes that matter in practice:
- Independence is an assumption. A GC pause on a shared host can slow several of your calls at once. Correlation shifts the numbers in either direction; it doesn't change the fact that fan-out multiplies exposure.
- Sessions multiply again. Thirty page loads at a 1% slow-page rate means about 26% of sessions see at least one slow page.
I think of each call as a lottery ticket where the prize is the slow response. A page buys one ticket per call.
Budget from the page down
The formula also runs backwards, and that's the most useful thing you can do with it. If you want 99% of page loads to be fast, each of the n calls must be fast with probability 0.99^(1/n):
| Calls per page | Per-call target needed for a p99 page |
|---|---|
| 10 | p99.9 |
| 20 | p99.95 |
| 40 | p99.975 |
| 100 | p99.99 |
So a service team hitting p99 is not "meeting the target" for a 40-call page. It's contributing to a page that's slow one load in three. Service SLOs need to be tighter than page SLOs, by exactly the fan-out.
Where the tail comes from
Slow p99 requests rarely have a bug you can point at. The same endpoint with the same input ran fast a second earlier. Dean and Barroso's list of causes is mostly about the environment: shared CPU, caches, and network; background daemons and maintenance jobs; garbage collection; power and energy management; and queueing.
Queueing is the big one. A slow request is often a fast request that waited behind something: a big job hogging a worker, a lock held a little long, a momentarily empty connection pool. You can shrink the tail. At scale, you can't remove it. So design pages that don't have to wait on the unlucky call.
Three habits that hide the tail
1. Measuring services instead of the wait
Every team graphs its own service, every graph is accurate, and nobody graphs the page. Add end-to-end p99 for your most important pages or jobs: real-user monitoring, gateway timing, or full-request traces.
2. Averaging percentiles
Ten hosts, equal traffic. Nine have a p99 of 100 ms. One is sick, and 30% of its requests take 3 seconds.
- Average the per-host p99s:
(9 × 100 + 3000) / 10 = 390 ms. - Count requests: the sick host serves 10% of traffic, 30% of that is slow, so 3% of all requests take 3 s. The real fleet p99 is 3,000 ms.
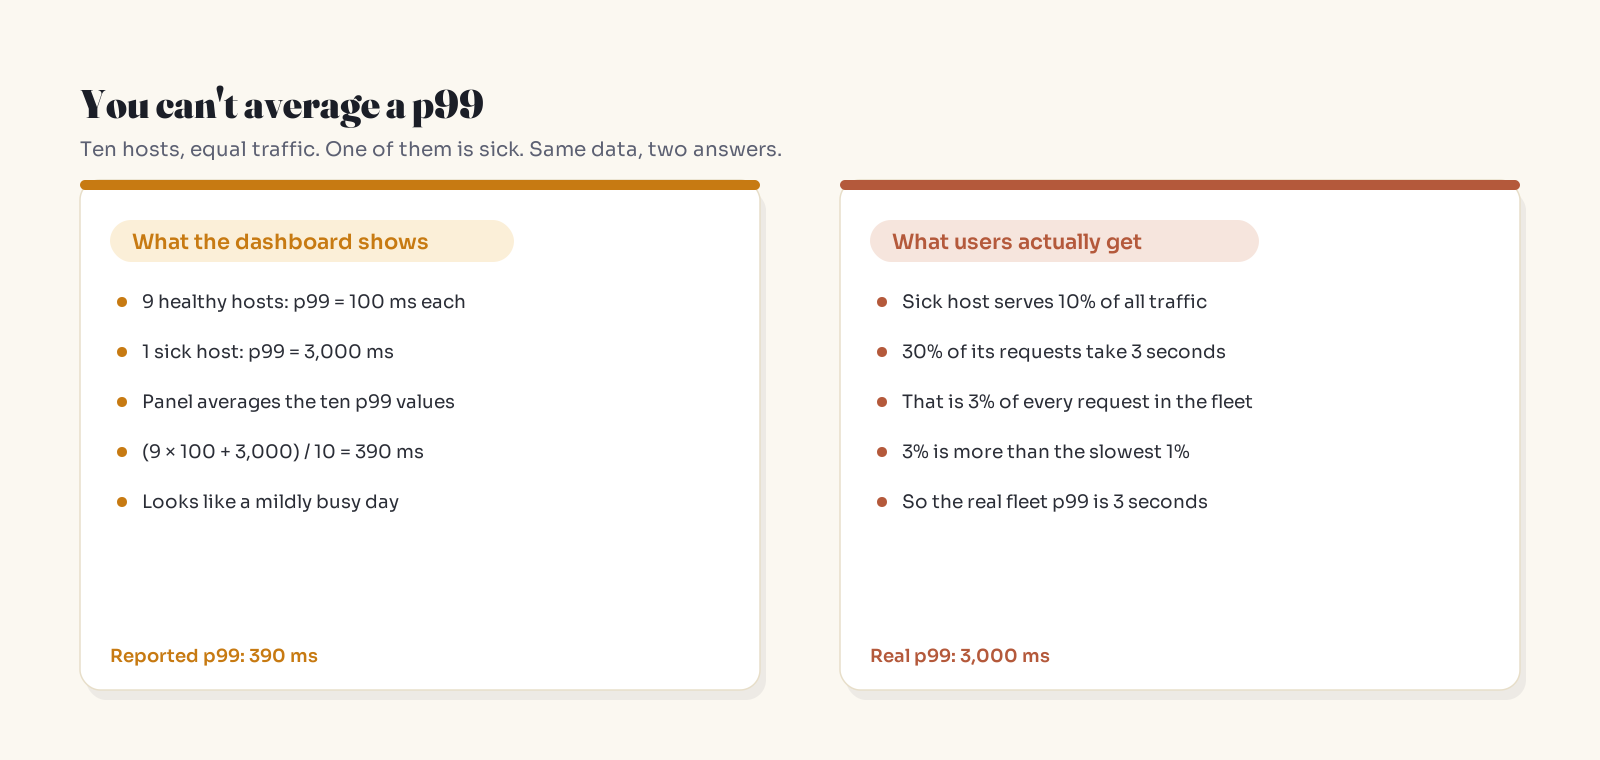
Percentiles don't average, across hosts or across time windows. Histograms merge. In Prometheus:
# Wrong: averaging precomputed quantiles (summaries)
avg(http_request_duration_seconds{quantile="0.99"})

# Right: sum histogram buckets across instances, then compute the quantile
histogram_quantile(
  0.99,
  sum by (le) (rate(http_request_duration_seconds_bucket[5m]))
)
The Prometheus docs use almost exactly that first query as their example of a statistically nonsensical aggregation.
3. Closed-loop load tests (coordinated omission)
A typical load loop sends a request, waits for the reply, then sends the next. Thought experiment, in the style Gil Tene uses to explain this: the system answers in 1 ms, the test runs 100 seconds, and the server freezes for 10 seconds in the middle.
- What the tool records: about 90,000 fast requests and one slow one. Even p99.99 reads 1 ms.
- What users get at 1,000 requests per second: about 10,000 arrive during the freeze, waiting anywhere from almost 10 seconds down to almost nothing. The real p99 is around 9 seconds.
The tool stopped sending exactly when things were worst. Tene calls this coordinated omission. Use an open-model, fixed-arrival-rate generator: wrk2 was built for this, and k6's constant-arrival-rate executor is documented with coordinated omission in mind.
Fixes, in the right order
- Remove tickets. Batch lookups, collapse chatty calls, and kill N+1 patterns. A faster call is still a ticket; a removed call isn't.
- Stop blocking on optional data. Recommendations and badges can load late or be dropped after a short deadline.
- Budget per call using the table above, and set deadlines from the page budget down.
- Hedge last. Send a second copy of an idempotent read to another replica if the first hasn't answered by about its p95, and take whichever returns first.
The case for hedging is strong. Dean and Barroso report a Google benchmark reading 1,000 keys from BigTable across 100 servers: hedging after 10 ms cut 99.9th-percentile latency from 1,800 ms to 74 ms while sending just 2% more requests.
The constraints are what keep it from hurting you:
- Idempotent operations only. Both copies may run. Anything with side effects needs idempotency keys, or no hedging.
- Hedge late (around p95) so extra load stays small.
- Cap hedges with a budget. Under fleet-wide overload every request crosses the threshold, and unbudgeted hedging becomes the kind of load amplification that keeps systems down.
- Cancel the loser.
A JavaScript sketch with a budget and cancellation:
const HEDGE = Symbol("hedge");

async function hedged(call, hedgeAfterMs, budget) {
  const a = new AbortController();
  const b = new AbortController();
  const first = call(a.signal);
  const timer = new Promise((r) => setTimeout(r, hedgeAfterMs, HEDGE));

  if ((await Promise.race([first, timer])) !== HEDGE || !budget.trySpend()) {
    return first; // fast enough, or out of hedge budget
  }

  const second = call(b.signal);
  return Promise.any([
    first.then((v) => (b.abort(), v)),  // first wins: cancel the hedge
    second.then((v) => (a.abort(), v)), // hedge wins: cancel the original
  ]);
}
The Tail Audit
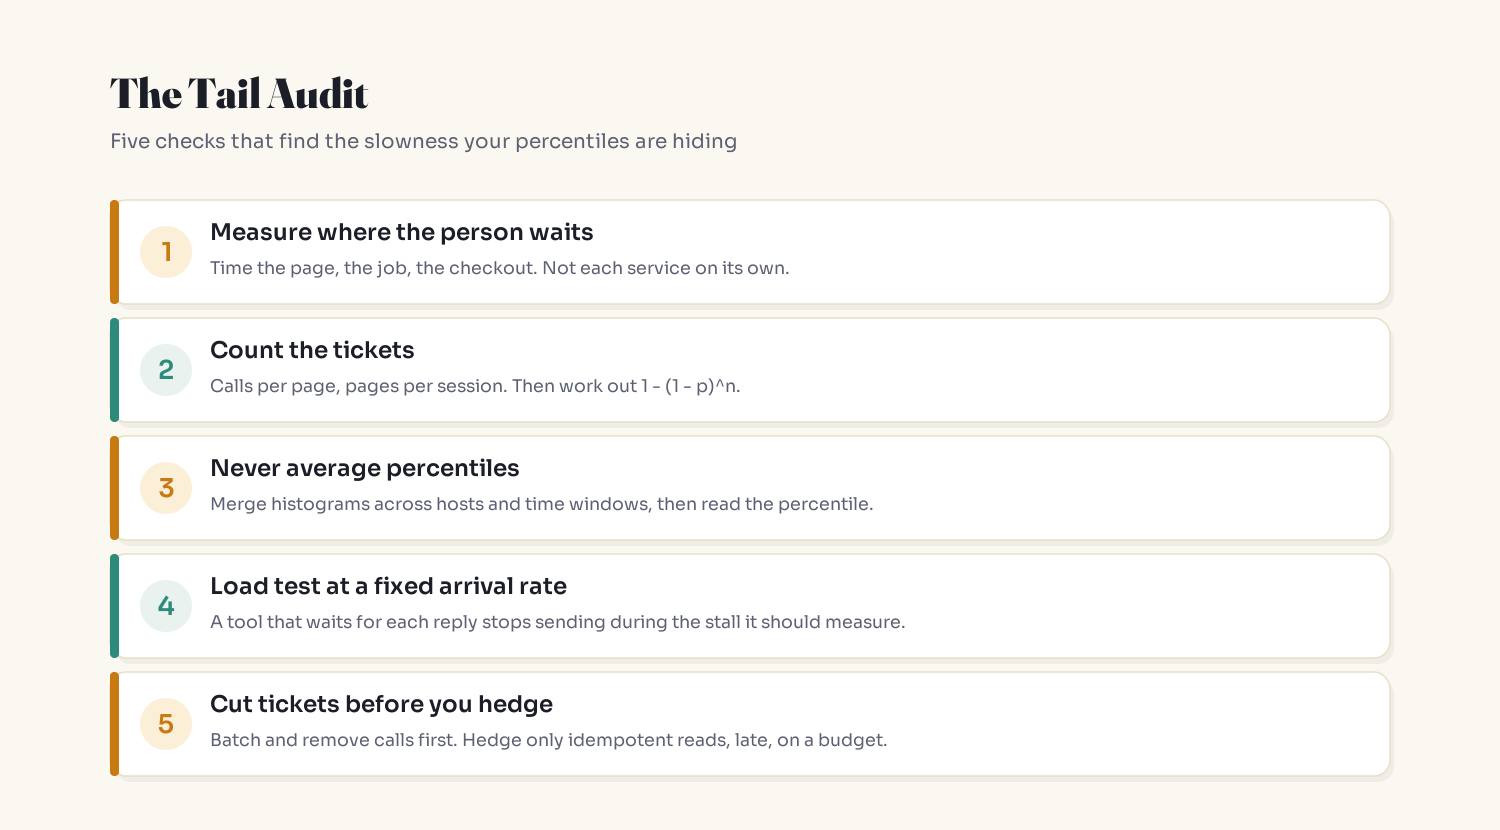
- Measure where the person waits. End-to-end p99 for your top pages and jobs.
- Count the tickets. Calls on the critical path, then
1 - (1 - p)^n. - Never average percentiles. Rebuild fleet panels from histograms.
- Load test at a fixed arrival rate. Make sure the tool keeps sending during stalls.
- Cut tickets before you hedge. Hedge idempotent reads last, late, and on a budget.
Key Takeaways
- A p99 describes requests; users experience pages and sessions built from many requests.
- The chance of a slow page is
1 - (1 - p)^n: 40 calls at p99 means about a third of loads are slow. - For a p99 page, each of
ncalls needs roughly a0.99^(1/n)target (p99.975 for 40 calls). - Averaged percentiles are meaningless; merge histograms first.
- Closed-loop load tests hide stalls (coordinated omission); use fixed arrival rates.
- Remove calls before hedging; hedge only idempotent reads, late, with a budget, and cancel the loser.
FAQ
What is tail latency?
Tail latency is the response time of the slowest requests, usually measured at high percentiles like p99 or p99.9. It matters because users interact with pages and workflows made of many requests, so rare slow requests show up in a large share of user experiences.
Why is my p99 fine but users say the app is slow?
Because p99 is measured per request, per service. A page that waits on many calls is slow whenever any one of them is slow. With 40 calls at a 1% slow rate, about 33% of page loads include a slow call, even though every service meets its p99.
How do you calculate the impact of fan-out on latency?
If each call is independently slow with probability p, a request with n calls is slow with probability 1 - (1 - p)^n. To hit a target for the whole page, each call needs a per-call success rate of target^(1/n), for example p99.975 per call for a 40-call page with a p99 goal.
Can you average p99 latency across servers?
No. Averaging percentiles produces numbers that don't correspond to any real request distribution and can be wrong in either direction. Store latency as histograms, sum the buckets across servers and time windows, and compute the percentile from the merged histogram.
What is coordinated omission in load testing?
Coordinated omission happens when a load generator waits for each response before sending the next request. During a stall it stops sending, so it records very few slow samples and reports optimistic percentiles. Fixed-arrival-rate tools such as wrk2 or k6's constant-arrival-rate executor avoid it.
Are hedged requests safe to use?
Hedged requests are safe for idempotent reads when you send the hedge late (around the p95 latency), cap hedges with a budget, and cancel the losing request. Without a budget they can amplify load during overload, and without idempotency they can execute side effects twice.
Related reading
- The N+1 Query Problem: Why Your App Is Fast in Dev and Slow in Production
- Your Database Is Fine. Your App Is Dying Anyway.
- The Cause Was Fixed. The Outage Wasn't.
- Why Your API Charges People Twice (And the One Idea That Fixes It)
The bottom line
Every service in your system can be fast while the product is slow. Count the calls each page waits on, measure where the user waits, and budget from the page down.
Your p99 is rare per request and routine per person.
New here? Start Here: a plain-English map to everything I write. Get one of these in your inbox each week: subscribe to Simply Explained on Substack.
Adam Jaber is a software engineer who writes Simply Explained: complex topics, made simple. No jargon, no hype.
About the author
- I'm a software engineer who spends most days building systems that solve real problems. When I'm not shipping code, I'm either untangling a tricky problem or writing about what I learned doing it. Currently exploring AI on the side.
Comments
Join the discussionNo comments yet. Be the first to comment.