How to Read a Stack Trace Backward: The Crash Line Is the Victim
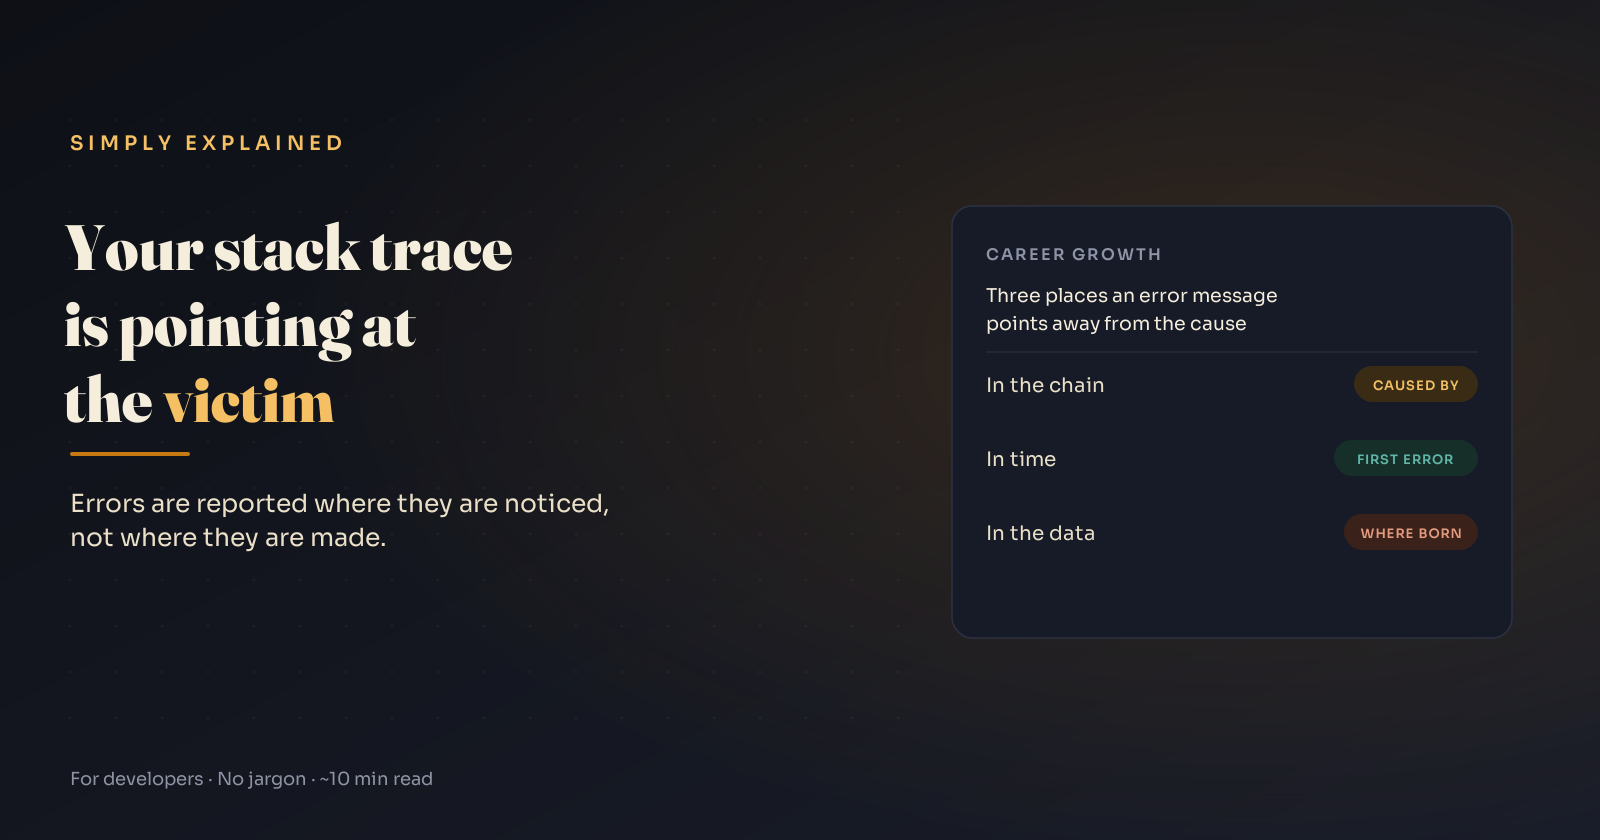
Errors are reported where they're noticed, not where they're made. A language-by-language guide to finding the real cause.
Here's a Python traceback from a payment webhook handler. Before reading further, decide which line you'd search for:
Traceback (most recent call last):
  File "webhooks.py", line 14, in parse_event
    amount = payload["amount_cents"]
KeyError: 'amount_cents'

The above exception was the direct cause of the following exception:

Traceback (most recent call last):
  File "webhooks.py", line 31, in handle
    event = parse_event(payload)
  File "webhooks.py", line 16, in parse_event
    raise WebhookError("could not parse payment event") from err
WebhookError: could not parse payment event
Most people copy the last line. It's the biggest, it's at the bottom where Python "always" puts the answer, and it's useless: could not parse payment event.
The real information is at the top: a key named amount_cents is missing. And even that line is a victim. Nothing is wrong with line 14. It was handed a payload in a shape it didn't expect, because the sender changed something. The bug lives outside this trace entirely.
That's the idea this whole post builds on:
Errors are reported where they're noticed, not where they're made.
TL;DR
- A stack trace records the call path at the moment of the crash. It does not record where the bad value came from.
- The root cause hides in three places: in the chain (wrapped exceptions), in time (the first error, not the most frequent), and in the data (a value created by code that already finished).
- Where the deepest cause is printed flips by language. Learn yours.
- Before fixing the crash line, run the Victim Test: is this line wrong, or was it handed something wrong?
The mental model: checkpoints, not culprits
Most code doesn't validate most values. A bad value flows through functions, into a database, onto a queue, until it hits the first line that can't tolerate it: a property access, a type check, a constraint, a parser. That line is a checkpoint. The exception fires there.

The distance between the line that broke and the line that noticed is the debugging. Dependability engineering has words for both ends: the fault (the defect), the error (the wrong state), and the failure (the visible break). A stack trace is a snapshot of the failure.
Stack traces still earn their reputation. A 2010 study of Eclipse bug reports by Schröter, Bettenburg and Premraj found strong evidence that they help developers fix bugs, and later work summarizing it reports the fixing location appeared in the trace in around 60% of reports, usually in the top ten frames. Flip that around: in roughly four of ten, the line that needed to change wasn't in the trace.
Misdirection #1: in the chain
Wrapping is good practice: each layer adds context. But the outermost message is the most generic, and it's the one you read first. Where the original is printed depends on the language.

Python: oldest exception first
Chained tracebacks print the original exception at the top. Two separators tell you how they're linked:
The above exception was the direct cause of the following exception:means someone wroteraise NewError(...) from err.During handling of the above exception, another exception occurred:means a second exception happened while handling the first, implicitly.
Within each traceback, frames are listed most recent call last.
Java: deepest cause last
com.shop.ServiceException: Failed to load order 8812
    at com.shop.OrderService.load(OrderService.java:57)
    ...
Caused by: com.shop.RepositoryException: query failed
    at com.shop.OrderRepository.find(OrderRepository.java:33)
    ... 12 more
Caused by: java.sql.SQLTransientConnectionException: HikariPool-1 - Connection is not available, request timed out after 30000ms.
    ...
The outermost exception prints first, and each Caused by: goes one level deeper. Read the last Caused by:. The ... 12 more line means those frames are shared with the exception above, so they were omitted, not lost.
Notice that even the deepest cause here is a victim. "Connection is not available" says the pool was empty, not why. That's a time problem, covered below.
JavaScript: only if someone passed cause
try {
  await chargeCard(order);
} catch (err) {
  throw new Error(`charge failed for order ${order.id}`, { cause: err });
}
ES2022 added cause, and Node prints it nested inside the outer error. Without it, throw new Error("charge failed") discards the original stack completely.
Go: read the end of the string
if err != nil {
    return fmt.Errorf("load user %d: %w", id, err)
}
// prints: load user 42: query users: dial tcp 10.0.0.5:5432: connect: connection refused
Each wrap prepends context, so the root cause is at the end of the message. Use %w, not %v: %w keeps the error unwrappable so errors.Is and errors.As still work.
Misdirection #2: in time
Production failures cascade. A slow database causes timeouts, clients retry, retries hold connections, the pool drains, and every endpoint starts throwing "timeout acquiring connection" thousands of times a minute.
Sort your error dashboard by count and you get the fallout. Sort by time and look at the window just before the spike, and you'll usually find the first unusual entry, often logged only a few times.
Compilers do this in miniature. GCC's -Wfatal-errors stops at the first error for exactly this reason: the rest of the screen is often the compiler confused by the first.
Misdirection #3: in the data
The trace can't see a null written by last week's code, a config value changed this morning, a cached object from before the deploy, or a message from an older producer version. The crashing code is innocent; the data was made by code that already exited successfully.
Java's helpful NullPointerExceptions (on by default since Java 15) show both the progress and the limit:
Cannot read field "c" because "a.b" is null
It names the bad value precisely. It can't say who set a.b to null, because that happened in the past.
Five ways code destroys the evidence
1. Throwing from finally (Java). The cleanup exception replaces the one in flight:
try {
    process(batch);   // the real failure
} finally {
    reader.close();   // if this throws, the real failure is gone
}
Try-with-resources attaches the cleanup failure as a suppressed exception instead:
try (var reader = openReader(path)) {
    process(batch);
} // close() failures show up under "Suppressed:"
2. raise ... from None (Python). Hides the context. Fine for a deliberate public error, destructive when the context was the real failure.
3. Rethrowing without a cause. throw new ServiceError("Failed to load user") keeps the message, drops the evidence.
4. Logging only the last retry. The first attempt and the last can fail for different reasons:
for attempt in range(1, 4):
    try:
        return call_api()
    except Exception as err:
        log.warning("call_api failed", extra={"attempt": attempt, "error": repr(err)})
        if attempt == 3:
            raise
5. Error handlers that fail. A logger that crashes while formatting the error produces a second error, and that's the one you'll see.
The Victim Test
Before editing the line the trace names:
Is this line wrong, or was it handed something wrong?
If the line is wrong, fix it there. If it was handed something wrong, a quiet guard is a silencer:
// Silencer: the crash stops, the bug becomes invisible
if (!order.user) return;

// Checkpoint: same check, but it creates evidence
if (!order.user) {
  throw new Error(`order ${order.id} has no user (created ${order.createdAt} by ${order.source})`);
}
Same condition. One deletes evidence, the other moves the checkpoint toward the cause.
The Backward Read: a 5-step checklist

- Find the first error, not the loudest. Filter to the window before the symptom, sort by time.
- Follow the chain to the deepest cause. Last
Caused by:, top of a Python chain, innermost[cause], end of a Go message. - Find your first frame. Skip framework frames; start where your code made a decision.
- Name the bad value, then ask where it was born. Who wrote it, when, from what input? Expect to leave the stack: row timestamps, producer versions, deploy and config history.
- Check for erased evidence. A suspiciously short chain usually means something above happened.
For the webhook at the top, step 4 is the whole investigation. When did payloads stop including amount_cents? What changed on the sender's side at that time? The fix goes where the payload enters your system, not on line 14.
Key Takeaways
- The crash line is where a bad value was noticed. The defect is often upstream in time, in the chain, or in the data.
- Root-cause position flips by language: Python top, Java last
Caused by:, JS innermostcause, Go end of string. - Sort by time before count when production is throwing errors.
- Chain, never replace:
from err,new X(msg, cause),{ cause },%w. - Validate at the door so the checkpoint sits next to the cause.
- Quiet guards silence bugs. Loud guards with context create evidence.
FAQ
How do you read a stack trace?
Start by identifying the exception type and message, then find the deepest cause in the chain (its position depends on the language), then the first frame in your own code. Finally, ask where the bad value in that frame came from, which is often outside the trace.
Is the root cause at the top or the bottom of a stack trace?
It depends on the language. Python prints chained exceptions oldest first, so the original error is at the top. Java prints the outermost exception first and the deepest cause in the last Caused by: section. In Go, the root cause is at the end of the wrapped message string.
What does "Caused by" mean in a Java stack trace?
It marks the exception that triggered the one above it. Each Caused by: is one level deeper, so the last one is the original failure. The ... N more lines mean frames identical to the enclosing trace were omitted.
What does "During handling of the above exception, another exception occurred" mean in Python?
A second exception was raised while the first was being handled, without an explicit raise ... from. The first exception, printed above the message, is usually the one to investigate.
Why doesn't the stack trace show where the bug is?
A stack trace records the call path at the moment of the crash. If the bad value was created earlier by a different request, job, deploy or config change, that code isn't on the stack anymore. The trace shows where the problem was noticed, not where it was made.
Should I add a null check where the error happens?
Only if that line is genuinely wrong. If it was handed a bad value, a check that returns quietly hides the bug. A check that throws with the value, its ID and where it came from is useful, but the real fix belongs where the value was created or first entered your system.
Related reading
- Your Database Is Fine. Your App Is Dying Anyway.: the error says database, the cause is the pool.
- The Cause Was Fixed. The Outage Wasn't.: why the loudest errors keep going after the trigger is gone.
- Your Worker Read the Past. Then It Saved It.: bad data born somewhere the trace can't see.
- Nobody Deployed Anything. Production Broke Anyway.: config and data changes as the hidden cause.
- Junior Developers and AI: Your Errors Were the Training All Along: why reading errors well is how you learn a system.
The bottom line
The common habit is to treat an error as an instruction: go to line 41, change line 41. Treat it as testimony instead. Line 41 is where something was noticed. Your job is to find out who sent it there.
The error isn't lying to you. It's telling you exactly where it was standing when it noticed.
New here? Start Here for the map of everything on Simply Explained. Get one of these in your inbox each week: subscribe on Substack.
Adam Jaber is a software engineer who writes Simply Explained: complex topics, made simple, no jargon, no hype.
About the author
- I'm a senior software engineer. I write Simply Explained, a plain-English breakdown of how AI and software actually work, and the quiet ways they break: AI fixes that hide bugs, agents that pick the wrong tool, health checks that take down healthy servers. One symptom, one analogy, one fix per piece. New here? Start with the pinned Start Here guide, or get one breakdown a week by email.
Comments
Join the discussionNo comments yet. Be the first to comment.